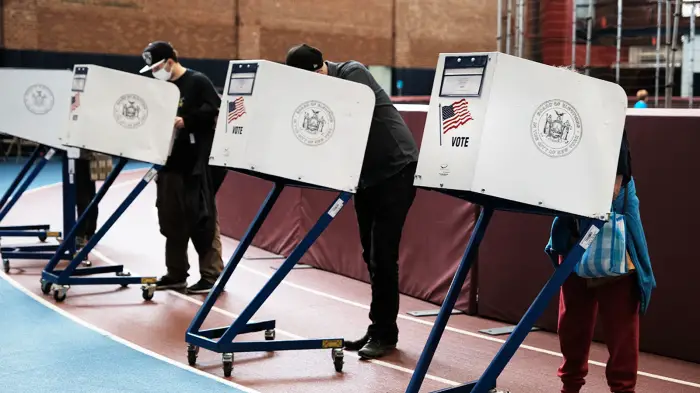
To state the obvious: A lot is at stake in November. The 2022 midterm elections will not only decide control of both the U.S. House and Senate, but also who sits behind the governor’s desk in 36 out of the nation’s 50 states.
History tells us that midterm elections generally go well for the party that’s not in the White House. But how can we tell whether that’s shaping up to happen again this cycle? As we inch closer to Election Day, there are four big indicators you can watch to give you an idea of which way the political winds are blowing.
Contents
Biden’s approval rating
The first number to keep an eye on is President Biden’s approval rating. Since World War II, there has been a decent relationship between the president’s average net approval rating (approval rating minus disapproval rating) on the day of the midterm elections and how many seats his party has lost in the House of Representatives. As you can see in the chart below, the president’s party has almost always lost seats — but popular presidents have been able to mitigate their losses.
Since World War II, presidents with net approval ratings better than +30 percentage points on a midterm’s Election Day have lost an average of only three House seats. Meanwhile, presidents with net approval ratings between +5 and +30 points on Election Day have lost an average of 24 seats, and presidents whose net popularity was worse than +5 points — which includes every president since 2006 — have lost an average of 39 seats.
The relationship isn’t perfect, though. President Dwight Eisenhower was extremely popular on Election Day 1958 (a net approval rating of +30.0 points), but Republicans still lost 47 House seats. And in 1974, President Gerald Ford was pretty popular (+19.8 points), but Republicans, still tainted by association with disgraced ex-President Richard Nixon (who had resigned just three months earlier), still lost 43 House seats.
Similarly, the worst midterm performance since World War II — a loss of 63 seats — was turned in by Democrats in 2010, when President Barack Obama’s net approval rating wasn’t that bad (-4.3 points). In fact, Obama’s net approval rating was far worse in 2014 (-11.3 points), yet Democrats lost only 13 House seats that year.
But it remains true that no president with an underwater net approval rating since World War II has ever lost fewer seats than Obama’s 13 in 2014. And the only times in the modern era that the president’s party gained House seats (1998 and 2002), the president’s net approval rating was astronomically high: more than +30 points.
This bodes poorly for Democrats in 2022. While Biden entered the White House earlier this year on a high note (his initial net approval rating was +17 points), his approval has ticked down almost ever since. Currently, Biden’s net approval rating is -8.4 points.
Of course, there are still 10 months between now and Election Day 2022, so it’s difficult to say what will happen to Biden’s approval rating in that time. There is ample historical precedent for it to get worse: In nine of the previous 11 midterm election years, presidents had a lower net approval rating on Election Day than they did on Jan. 5 earlier that year. But both Bill Clinton in 1998 and Donald Trump in 2018 bettered their net approval ratings between Jan. 5 and Election Day, suggesting that it is still possible for Biden’s approval to bounce back. Regardless, though, Biden faces an almost impossible climb to get his net approval rating up to the point where past presidents have actually seen their party gain House seats.
Generic congressional ballot polls
Another helpful tool for predicting the results of the midterm elections is generic congressional ballot polling, which asks voters which party they plan to support in the upcoming congressional election without naming specific candidates. In fact, this is probably the best single indicator we have of the national political mood. In midterm elections since 1974, there has been a strong correlation between the generic-ballot polling average on Election Day and the national House popular vote for that election.
Over that time, the generic-ballot polling average has missed the national House popular vote margin by an average of only 4.1 points. And it’s been even more accurate in recent midterms, when there has been a larger sample size of polls to consider. Since 1998, the generic-ballot polling average has missed the popular vote by an average of only 2.8 points.
Currently, Republicans lead generic-ballot polls by an average of 0.5 points. And although there’s still time for that to change before Election Day, generic-ballot polling has historically tended to get worse for the president’s party as the cycle wears on. So we can be pretty confident that Republicans will still have the polling lead on Nov. 8, and that the final generic-ballot polling average will be close to the final election result. But that doesn’t mean we know how big of a lead Republicans will hold by November and, potentially, win the 2022 popular vote by.
Special elections
A third indicator to watch ahead of the midterms is the results of special elections for Congress and state legislatures — in other words, elections that are held on an irregular schedule because a seat unexpectedly became vacant (due to a resignation, a death, etc.). But you have to be smart about interpreting them. Namely, it’s important to look beyond mere wins and losses; pay attention to the winning candidate’s margin of victory instead. This is because many special elections take place in deeply Republican or deeply Democratic districts, so the range of realistic outcomes really runs only between a strong win and a weak win for the dominant party.
For example, Republican Debbie Lesko’s victory in the 2018 special election for Arizona’s 8th District (which had a FiveThirtyEight partisan lean of R+27) wasn’t particularly meaningful or surprising, but the fact that she won that race by only 5 points was a sign that Democrats had the wind at their backs that year. If Democrats were coming close to winning a district that red, it suggested a lot of Republicans in lighter-red districts could very well lose their seats — and that’s exactly what happened in November.
That said, individual special elections can be misleading. By definition, they take place under unusual circumstances, and idiosyncratic factors like a niche local issue or a particularly weak candidate on one side can skew the result. Instead, special elections are much more reliable as an indicator when you look at them in the aggregate — canceling out some of those local factors until you’re left with only overarching national trends.
Indeed, when one party consistently does better in special elections than it normally does in those districts, it’s historically been a good sign for that party in the upcoming midterms. In fact, the average magnitude of overperformance in special elections has correlated with the national House popular vote that cycle (the one exception in the last 30 years is 1998, when President Bill Clinton’s impeachment scrambled the normal midterm dynamics).
But so far, special election results are one of the better indicators for Democrats’ prospects in 2022. In the six U.S. House special elections that took place in 2021, Democrats overperformed in three, while Republicans overperformed in two (the sixth didn’t have a significant over- or underperformance). Moreover, the average margins in these special elections were not that different from the average partisan leans of these districts, which suggests Republicans aren’t overperforming in the same way Democrats did in 2018.
2021 special elections haven’t told us much
How the final vote-share margins in federal special elections in the 2022 cycle compare with the seats’ FiveThirtyEight partisan leans
| Date | Seat | Partisan Lean | Vote Margin | Margin Swing |
|---|---|---|---|---|
| March 20 | Louisiana 2nd* | D+51 | D+66 | D+15 |
| March 20 | Louisiana 5th* | R+31 | R+45 | R+13 |
| May 1 | Texas 6th* | R+11 | R+25 | R+14 |
| June 1 | New Mexico 1st | D+18 | D+25 | D+7 |
| Nov. 2 | Ohio 11th | D+57 | D+58 | EVEN |
| Nov. 2 | Ohio 15th | R+19 | R+17 | D+2 |
| Average | D+11 | D+10 | EVEN |
But remember, special election results — like all the indicators in this article — are only approximate guideposts. And a midterm outcome of, say, R+5 or D+5 would still be perfectly consistent with these special election results. In other words, special elections aren’t telling us much at the moment. Maybe we’ll learn more from them in 2022; we are expecting at least two more federal special elections this year (in Florida’s 20th District on Jan. 11, and in California’s 22nd District sometime after that), and more could yet be added to the calendar.
Individual election polls
As we get closer to the midterms, race-specific polls will become one of the best indicators of who will win specific elections. Senate and gubernatorial polls conducted within three weeks of Election Day have had a weighted-average error of 5.4 points since 1998, while House polls have been almost as accurate, with a weighted-average error of 6.3 points. (And remember, a poll’s “error” is the difference between its margin and the actual election margin. So if a poll said the Republican would win by 10 points but they win by 6 points instead, the poll had a 4-point error.)
General election polls are usually pretty accurate
Weighted-average error of polls in the final 21 days before different types of elections, among polls in FiveThirtyEight’s pollster-ratings database
| Cycle | Governor | U.S. Senate | U.S. House |
|---|---|---|---|
| 1998 | 8.1 | 7.5 | 7.1 |
| 1999-2000 | 4.9 | 6.0 | 4.4 |
| 2001-02 | 5.3 | 5.4 | 5.4 |
| 2003-04 | 5.4 | 5.3 | 5.8 |
| 2005-06 | 5.1 | 5.2 | 6.5 |
| 2007-08 | 4.4 | 4.6 | 5.8 |
| 2009-10 | 4.7 | 5.0 | 7.0 |
| 2011-12 | 4.9 | 4.7 | 5.6 |
| 2013-14 | 4.5 | 5.3 | 6.8 |
| 2015-16 | 5.4 | 5.0 | 5.5 |
| 2017-18 | 5.1 | 4.2 | 5.1 |
| 2019-20 | 6.4 | 5.9 | 6.4 |
| All years | 5.4 | 5.4 | 6.3 |
Of course, a number of different pollsters are going to be releasing polls next year, so it’s important to know how to differentiate between a good and bad poll. We compiled a list of best practices in 2020, and all of these tips still stand. Perhaps the most important two, though, are checking pollsters’ track record of accuracy (which you can check using FiveThirtyEight’s pollster ratings) and looking at the average of the polls while treating outliers with a grain of salt.
In addition, always remember that polls have a margin of error. Polls aren’t foolproof; even field research conducted by the most nonpartisan organization that has identified the “perfect” sampling of eligible voters has room for error. Given the myriad challenges facing the polling industry today, it’s impressive that they typically miss the final margin by only 5 or 6 points — but that still means they typically miss the final margin by 5 or 6 points!
The majority of the time, that’s close enough to get the final outcome (i.e., a Republican win or a Democratic win) correct, but not always. When a poll gives you a result within the margin of error, it’s best to think of that race as a toss-up rather than take the poll literally down to the decimal point. If a poll gives the Democrat a 1-point lead but the Republican wins the election by 1 point, the poll was actually pretty accurate — an error of only 2 points — despite “calling” the winner incorrectly.
If you spend the next year keeping tabs on these four indicators, you’ll be well informed about how the midterms are shaping up. But four things can be a lot to follow — and, for that matter, what if some of them contradict each other? That’s why we at FiveThirtyEight build our election forecast models every two years: They’re the best way to understand congressional elections because they synthesize dozens of indicators like these — from polls to partisanship to fundraising to candidate quality — into a single topline prediction.
As always, we’ll be releasing our 2022 forecasts the summer before the election, so check back then for a more precise prediction of how the midterms will turn out. Until then, we’ll be watching presidential approval, the generic congressional ballot, special elections and individual race polls right alongside you.